Systems Thinking: Feedback Loops and Second-Order Effects
See behavior as the result of relationships, stocks, flows, delays, and feedback—not isolated events—and design safer interventions.
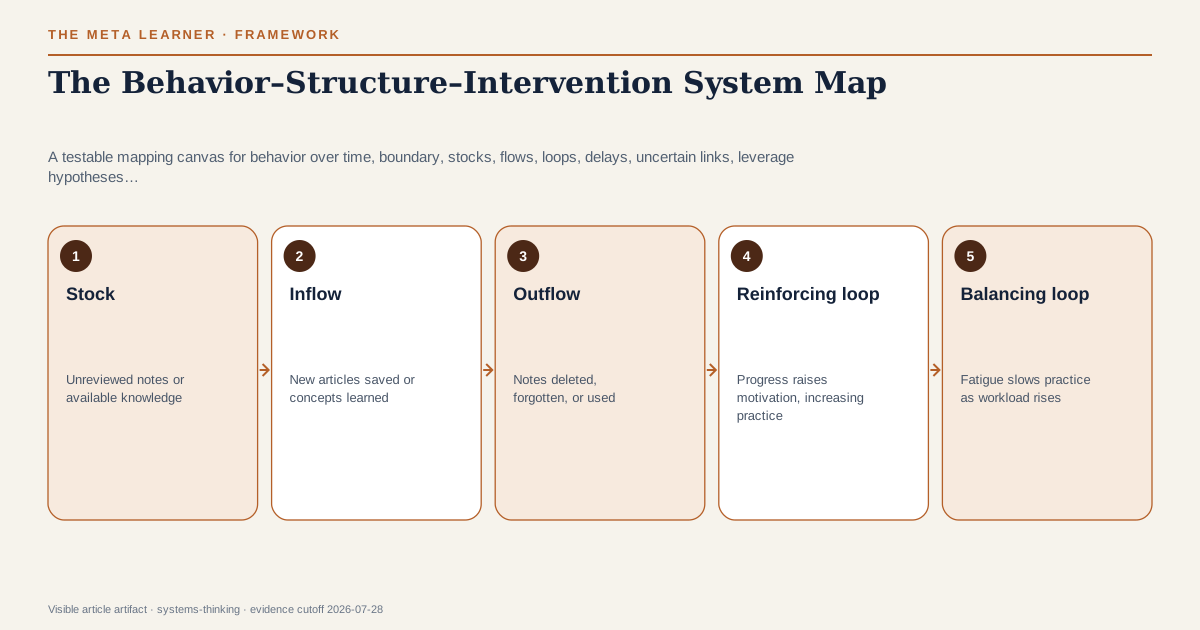
Systems thinking explains outcomes through interacting parts, accumulated stocks, flows, feedback loops, and delays. Instead of asking who caused one event, it asks what structure repeatedly produces the pattern and how an intervention might alter behavior elsewhere or later. Qualitative maps can omit boundaries, misstate polarity, or create false confidence; quantitative prediction requires data and validated models.
When recurring outcomes need a structural explanation
This guide is for people working on outcomes shaped by interacting actors, delays, incentives, and feedback. It covers boundaries, stocks and flows, reinforcing and balancing loops, delays, and second-order effects. Use this when a pattern recurs, accumulates, oscillates, or resists a local fix and several actors can respond to intervention. Do not use a system map as decoration, as proof of causality, or to postpone urgent relief. It is a bounded hypothesis about structure, not a complete prediction of a complex system.
The approach is valuable when a problem persists despite repeated fixes: study backlogs, organizational overload, traffic congestion, platform incentives, or AI-generated information volume. A system map does not predict the future by itself; it creates a set of hypotheses about behavior.
Core elements
| Element | Learning-system example | |---|---| | Stock | Unreviewed notes or available knowledge | | Inflow | New articles saved or concepts learned | | Outflow | Notes deleted, forgotten, or used | | Reinforcing loop | Progress raises motivation, increasing practice | | Balancing loop | Fatigue slows practice as workload rises | | Delay | Study today affects recall weeks later |
An arrow should name a relationship: when A increases, does B tend to increase or decrease, all else equal? Vague arrows create decorative diagrams.
What systems traditions contribute
Systems-thinking traditions across system dynamics and organizational learning emphasize feedback, accumulation, delay, boundaries, and unintended consequences. Research on learning in complex systems also distinguishes learning about a modeled structure from learning within a changing system. These are modeling tools rather than a single experimentally validated intervention. Their value depends on whether the map generates accurate explanations and useful tests.
1, 2, 3, 4Find the behavior over time
Before drawing a loop, plot the pattern. Is performance rising, oscillating, plateauing, or collapsing after a delay? The same current number can arise from different structures.
Suppose an AI reading tool doubles article intake. The visible benefit is faster capture. A second-order effect may be a growing review stock, lower selection quality, and reduced trust in the archive. The intervention improved one flow while destabilizing the larger system.
A testable mapping protocol
Follow this procedure: state the recurring behavior and time horizon; define a boundary and the actors inside it; identify at least one stock with inflows and outflows; draw the smallest set of variables that could explain the pattern; mark reinforcing and balancing loops; then attach an observation or uncertainty flag to each important link. Challenge the provisional map by asking:
- Which relationship is supported by data?
- Where is a delay being ignored?
- Who or what is outside the boundary?
- Which actor changes behavior in response?
- What observation would falsify the loop?
Avoid moral labels such as “bad incentives” when a measurable variable would be clearer.
Adapt the map when evidence moves
Adapt the boundary before adding complexity. If the map predicts the direction but misses the timing, inspect delays and measurement frequency. If it explains one team while shifting costs to another, widen the actor boundary. If two different structures fit the same historical curve, retain both variants and design an observation that separates them. If intervention changes how actors behave, redraw the response loop rather than treating adaptation as noise. A common failure mode is to keep adding arrows until every outcome can be narrated; a useful map becomes more falsifiable as it changes.
Case: notification gains that return as fatigue
A company increases notifications to raise engagement. Short-term clicks rise, but fatigue increases opt-outs and weakens long-term trust.
One short-term uplift does not identify the structure that produced it. The team must connect the observed trajectory to delay, regeneration, and displaced cost while preserving rival explanations:
| Observed signal | What it may mean | Next response | |---|---|---| | Immediate improvement | A delayed cost may be absent | Extend the time horizon | | Recurring symptom | A feedback loop may regenerate it | Map what changes after the intervention | | Local optimization | Costs may move elsewhere | Include affected actors and measures |
The team maps attention, fatigue, trust, and opt-outs; identifies delay; and tests frequency by cohort. The map produces a falsifiable monitoring plan rather than an ornamental explanation.
This notification map is a falsifiable hypothesis for one product and cohort, not proof that the proposed loop governs every platform. The cohort response, time horizon, and omitted actors determine whether the structure survives contact with evidence.
The unaided dynamic transfer test
Give the mapper a new context with a different surface story but an analogous accumulation, delay, or feedback problem. Without the original diagram, require an unaided test: plot behavior over time, define a defensible boundary, identify a stock and flows, propose rival loop structures, and name an observation that would discriminate between them. Transfer is not copying familiar arrows. It is choosing the relevant system concepts, preserving uncertainty, and changing the map when observed behavior contradicts it.
Map one eight-week pattern
Map a recurring learning problem:
- Write the behavior over eight weeks.
- Identify one stock and its inflows and outflows.
- Add one reinforcing and one balancing feedback loop.
- Mark delays and uncertain links.
- Find a leverage point that changes structure, not just symptoms.
- Make a small reversible intervention.
- Monitor the pattern and redraw the map.
For a growing reading backlog, the leverage point may be an admission rule rather than faster summarization. Test by limiting intake and measuring completed synthesis.
Preserve competing loop hypotheses
Before changing the learning process, record five fields: the target performance, the present evidence, the change you will make, the result you predict, and the date of review. For this topic, “immediate improvement” is a signal to investigate, not a conclusion. Name the feedback loop you believe is dominant and identify a measurable pattern that would contradict that causal reading. After the review, retain the original entry and append the outcome. Keeping the prior model visible stops every new outcome from being absorbed into an unfalsifiable systems story.
Maps that explain everything after the fact
- Drawing a complicated map before describing the pattern.
- Treating every connection as causal.
- Ignoring actors who adapt to the intervention.
- Choosing a boundary that excludes costs.
- Calling any downstream event a “second-order effect.”
- Using a loop diagram as proof instead of a hypothesis.
Move from causes to learning loops
Use Five Whys with Evidence to test bounded causal branches before drawing a wider system. Apply Double-Loop Learning when evidence challenges a governing rule, and use an After-Action Review to return observed outcomes and negative findings to the map.
Where the map stops
System boundaries and causal links reflect judgment. Complex maps can create false confidence, while quantitative models inherit assumptions and data gaps. Some urgent problems still require immediate relief before structural understanding is complete.
Systems thinking expands the unit of attention: from the visible event to the structure that keeps making it likely, and from the first benefit to the consequences that return through the loop.
Named sources
Evidence and further reading
Published July 29, 2026. Substantively updated July 29, 2026. Evidence last verified July 28, 2026.
- : Added research grounding, entry and non-use rules, a testable mapping procedure, adaptations, failure modes, and transfer testing.