Correlation, Causation, and Mechanism: How to Judge Explanations
Association describes a pattern; causation asks what an intervention would change. Judge explanations with counterfactuals, diagrams, and rival mechanisms.
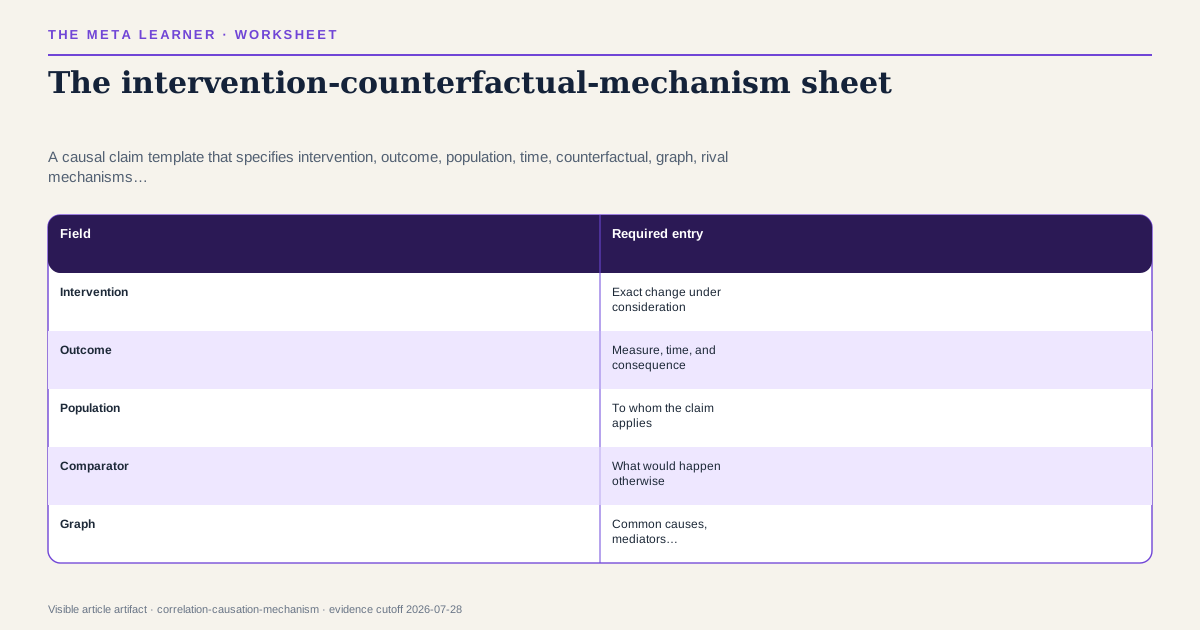
To judge a causal explanation, specify the intervention, outcome, population, and time; define the counterfactual comparison; draw plausible common causes and mediators; test rival mechanisms; and ask whether the design makes those alternatives less credible. A correlation is evidence to explain, not by itself an estimate of what intervention will do.
The explanation problem
People who use an AI tutor score higher. Teams that adopt a new tool ship faster. Cities with more bicycles report better health. Each pattern can be real while the implied intervention effect is wrong.
This article is for readers who must move from “X and Y vary together” to “X changes Y.” It avoids the equally crude response that observational evidence is worthless. The task is to identify what assumptions and design make the causal contrast credible.
The intervention-counterfactual-mechanism sheet: evidence and boundary
Modern causal-inference frameworks formalize causal questions through interventions, counterfactual outcomes, assumptions, and graphical or potential-outcome models. They distinguish observing X from setting X. Hill’s classic considerations show that causal judgment draws on patterns such as temporality, consistency, dose response, plausibility, and experiment, while explicitly warning against treating them as a mechanical checklist.
pearl-causal, hernan-robins, hill-environmentClaim sources: pearl-causal, hernan-robins, hill-environment
Write the causal contrast
Replace “Does AI improve learning?” with:
For adult beginners studying introductory statistics, what is the difference in delayed transfer performance after eight weeks if they use a specified AI feedback protocol rather than the same curriculum with human-authored feedback, under defined access and support?
The reformulation reveals that intervention, comparator, population, outcome, and time were previously missing.
Draw paths before controlling variables
Consider:
- prior expertise influences both AI use and performance;
- motivation influences use and practice time;
- AI use changes feedback speed;
- feedback speed changes practice;
- tool access differs by income.
A causal diagram makes these hypotheses inspectable. It also prevents the common error of controlling for every available variable. A mediator may be part of the effect you intend to estimate; a collider can create a spurious association when conditioned on.
The diagram does not prove the arrows. It records assumptions whose consequences can be challenged.
Mechanism is more than a story
A mechanism says how change propagates: AI shortens feedback delay, which increases corrected attempts, which improves discrimination. This account earns weight if it predicts intermediate observations:
- feedback delay actually falls;
- corrected attempts increase;
- improvement concentrates in tasks requiring discrimination;
- removing feedback removes much of the effect.
A polished narrative that predicts nothing distinct from its rival is not strong mechanistic evidence.
Rival explanations
For the AI-tutor association:
- Selection: more motivated learners choose the tool.
- Measurement: tool users take easier or differently scored tests.
- Co-intervention: instructors using the tool also redesign the course.
- Reverse direction: stronger learners are more willing to experiment.
- Proposed mechanism: faster targeted feedback changes practice.
Each rival implies a different discriminating design or observation. The goal is not to list endless possibilities but to test the plausible paths that would change the decision.
The intervention-counterfactual-mechanism sheet
| Field | Required entry | |---|---| | Intervention | Exact change under consideration | | Outcome | Measure, time, and consequence | | Population | To whom the claim applies | | Comparator | What would happen otherwise | | Graph | Common causes, mediators, selection paths | | Mechanism | Steps and intermediate predictions | | Strongest rival | Alternative path that fits current facts | | Discriminator | Evidence that separates the accounts |
Keep “unknown” visible. An empty field is safer than a generated assumption.
Build a causal claim sheet
- Rewrite the claim as a contrast.
- Establish temporal order.
- draw the smallest useful causal diagram.
- identify the strongest common cause and selection process.
- state whether the desired effect is total or mediated.
- name one rival mechanism.
- choose a design or data source that discriminates.
- record what remains unidentified.
- match action to the residual uncertainty and reversibility.
When stakes are low and a pilot is reversible, incomplete identification may be acceptable. High-stakes policy needs more.
Reversal and decision conditions
Prefer the proposed causal account when its predicted intermediate changes occur and credible rivals are weakened by design. Reverse or narrow it when the association disappears under a valid comparison, temporal order fails, a rival explains the same evidence better, or the mechanism’s predicted steps do not appear.
Even a real average causal effect may not justify action when harms are concentrated, the local population differs, implementation changes the intervention, or opportunity cost dominates. Causal identification and policy choice are distinct layers.
Causal reasoning failures
A useful negative control asks whether the proposed mechanism predicts an effect where none should occur. A useful positive control asks whether the measurement can detect an effect known to exist. Neither proves causation, but both can expose broken measurement or residual confounding. When intervention is impossible, triangulate designs whose biases differ rather than stacking many studies with the same weakness. Convergence matters most when rival explanations make different predictions.
- Saying “correlation is not causation” and ending the inquiry.
- Treating temporality alone as proof.
- Controlling for every measured variable.
- Using a mechanism story with no discriminating prediction.
- Hiding the comparator.
- Generalizing an average effect beyond its population and implementation.
- Treating an AI-generated diagram as discovered truth.
Decision and evidence boundary
This guide cannot substitute for formal causal analysis. Diagrams encode assumptions rather than validate them, and unmeasured confounding, measurement error, interference, attrition, and treatment variation can remain. Randomized experiments also face noncompliance, external-validity, ethical, and implementation limits. Consequential questions require qualified methodological and domain expertise.
The useful move is neither credulity nor paralysis. It is to turn explanation into a contrast, a model, a rival, and evidence capable of changing your mind.
Separate the layers with facts, inferences, and judgments, inspect warrants through critical thinking, and extend the mechanism to second-order effects.
Named sources
Evidence and further reading
Published July 29, 2026. No substantive revision has been recorded. Evidence last verified July 28, 2026.