The Evidence Map: Separate Claims, Sources, Assumptions, and Gaps
Build an evidence map that separates what you claim, what each source supports, which assumptions connect them, and which gaps remain open.
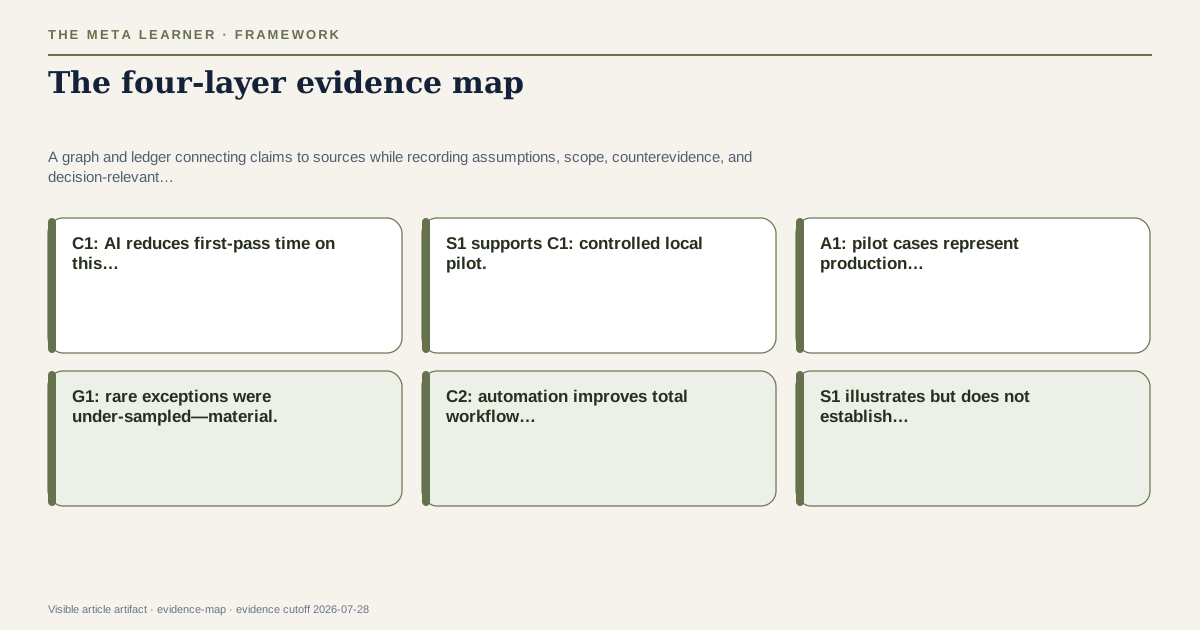
Build an evidence map with four distinct layers: claims, sources, assumptions, and gaps. Connect a source only to the exact claim it supports; label the inferential assumption that carries evidence to conclusion; add counterevidence and scope; and mark unanswered questions that could change the decision. Write the article from the map only after every material claim has a visible status.
The problem hidden by polished prose
Prose is good at smoothing transitions. It can make a sourced observation, an analyst’s interpretation, and a recommendation feel like one continuous fact. By the end of a paragraph, neither writer nor reader can see where evidence stopped and judgment began.
An evidence map interrupts that fluency. It is part graph, part ledger: every consequential claim becomes a node; every source, assumption, and gap becomes a different kind of node; links specify the relationship.
The method is useful before drafting, during fact-checking, and when revising an argument after challenge. It is not a visualization of everything known. It is a model of what the current decision depends on.
The four layers
Claims
Write atomic, contestable sentences. Split “AI improves productivity and job quality” into separate claims about output, time, error, worker experience, and distribution.
Classify each claim:
- observed fact;
- sourced conclusion;
- analyst inference;
- forecast or scenario;
- value judgment;
- recommendation.
Sources
Create one node per independent evidence unit—not necessarily per document. Several papers may report one study; one report may contain multiple datasets.
Record method, population, date, funding, scope, and appraisal status.
Assumptions
State the bridge:
- the measure represents the construct;
- the sample transfers to the target population;
- the mechanism persists at scale;
- faster production creates net value after review;
- current conditions will continue.
Assumptions are not embarrassments. Hidden assumptions are.
Gaps
Mark:
- missing evidence;
- uninspected sources;
- unresolved contradiction;
- unknown applicability;
- changing fact;
- unavailable affected perspective.
Give each gap a decision relevance: low, material, or blocking.
Use typed links
Do not draw a generic arrow. Label it:
- supports;
- contradicts;
- qualifies;
- defines;
- depends on;
- illustrates;
- does not establish.
“Illustrates” prevents a case study from silently becoming prevalence evidence. “Does not establish” preserves a tempting but invalid inference at the point where it would otherwise return.
Systematic-review guidance supports structured tables, explicit appraisal judgments, and transparent reasons for those judgments. Information-literacy guidance emphasizes authority, inquiry, and the process of information creation. The four-layer map is an editorial implementation of those principles, not a validated universal appraisal instrument.
Claim sources: cochrane-prepare, cochrane-bias, acrl-framework
Map at the result level
Cochrane guidance emphasizes risk of bias in results and asks reviewers to provide support for judgments.cochrane-bias, cochrane-prepare, acrl-framework Mirror that granularity. Do not stamp an entire institution, paper, or author “credible” and let the label flow to every claim.
A government statistical release may be authoritative for its defined dataset, silent on causal interpretation, and outdated for a fast-changing policy. A vendor may be the primary source for a product feature and a conflicted source for comparative value. A scholar may have deep domain expertise while making an unsupported forecast outside the study.
A miniature map
Decision: Should a team automate first-pass document review?
- C1: AI reduces first-pass time on this document class.
- S1 supports C1: controlled local pilot.
- A1: pilot cases represent production variation.
- G1: rare exceptions were under-sampled—material.
- C2: automation improves total workflow value.
- S1 illustrates but does not establish C2: review time fell.
- A2: downstream correction and escalation costs do not rise.
- G2: no downstream measurement—blocking.
- C3: pilot expansion is warranted.
- C1 supports C3; G2 qualifies C3.
- Recommendation: expand only within a controlled sample that measures downstream error.
The map turns “the pilot worked” into a bounded decision.
Build a claim ledger beside the graph
Graphs become crowded. Use a table:
| ID | Claim | Classification | Source IDs | Assumption | Counterevidence | Gap | Status | |---|---|---|---|---|---|---|---| | C1 | Exact sentence | Observed | S1 | A1 | S3 | G1 | Narrowed |
Statuses can be:
- verified for stated scope;
- narrowed;
- contested;
- unresolved;
- unsupported;
- editorial judgment.
This ledger also creates a clean fact-checking handoff.
Build the four-layer map
- Extract every material claim from a draft.
- Split compound claims.
- classify each one.
- Add source nodes and study-family IDs.
- Type every source–claim link.
- State the assumption behind every inference.
- Add counterevidence and gaps.
- Mark decision relevance.
- Rewrite or remove unsupported claims.
- publish the key evidence boundary with the final work.
Begin with Critical Thinking: A Practical System for Claims and Evidence, supply the inputs through Turn Book Notes Into Reusable Knowledge, and use Systems Thinking when relationships cross levels.
Maps that manufacture certainty
- Connecting a source to a paragraph instead of an exact claim.
- Treating several reports of one study as independent.
- Omitting assumptions because they seem obvious.
- Mapping supporting evidence while leaving counterevidence in prose.
- Using color to imply quality without an appraisal rule.
- Labeling every gap “future research” without decision relevance.
- Letting a dense graph create an aura of rigor.
Add a final adversarial pass: ask a reviewer to select the three edges carrying the greatest inferential weight, reopen their sources, and try to break them. Record the result even when the challenge fails. A map that cannot show how its strongest connection was tested is a diagram of confidence, not yet a defensible evidence instrument.
Structure is not truth
An evidence map can be precise and wrong. It inherits the search, appraisal, definitions, access, and judgment of its makers. It may omit non-English evidence, affected communities, tacit knowledge, or unknown dependencies. High-stakes work requires domain-specific methods, independent review, and current authoritative sources in addition to transparent mapping.
The map earns its place when it makes the argument easier to challenge—and the final claim more accurate because of that challenge.
Named sources
Evidence and further reading
Published July 29, 2026. No substantive revision has been recorded. Evidence last verified July 28, 2026.